[1]:
%matplotlib inline
import matplotlib.pyplot as plt
import numpy as np

import jax.numpy as jnp
from jax import random

from sgmcmcjax.samplers import build_sgld_sampler
Build a sampler function
In this series of notebooks we use logistic regression as the example. However the usage is exactly the same for other models.
[3]:
# import model and create dataset
from sgmcmcjax.models.logistic_regression import gen_data, loglikelihood, logprior

key = random.PRNGKey(42)
dim = 10
Ndata = 100000

theta_true, X, y_data = gen_data(key, dim, Ndata)

data = (X, y_data)
WARNING:absl:No GPU/TPU found, falling back to CPU. (Set TF_CPP_MIN_LOG_LEVEL=0 and rerun for more info.)
generating data, with N=100000 and dim=10
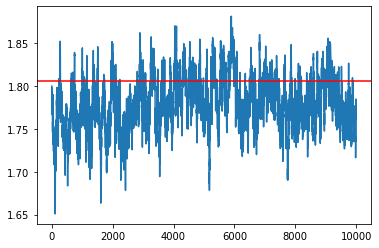
SGLD sampler
Just like in the logistic regression example notebook, we can simply create a sampler function given some hyperparameters such as step size and batch size
[10]:
batch_size = int(0.01*X.shape[0])
dt = 1e-5

my_sampler = build_sgld_sampler(dt, loglikelihood, logprior, data, batch_size, pbar=True)
[11]:
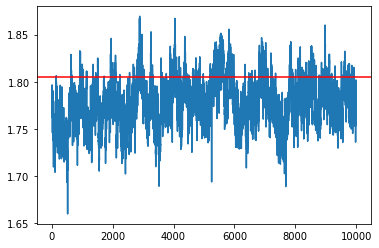
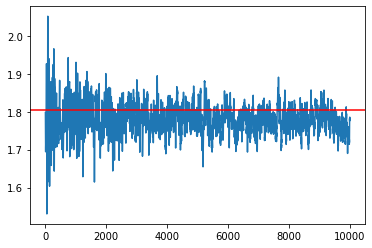
# Run sampler
key = random.PRNGKey(0)
Nsamples = 10000
samples = my_sampler(key, Nsamples, theta_true)

idx = 7
plt.plot(np.array(samples)[:, idx])
plt.axhline(theta_true[idx], c='r')
plt.show()
Other samplers
There are several available samplers:
sgld
sgld-cv
svrg-sgld
sghmc
sghmc-cv
svrg-sghmc
psgld
Their usage is very similar to sgld
[10]:
from sgmcmcjax.samplers import build_sgldCV_sampler, build_sgld_SVRG_sampler, build_psgld_sampler
from sgmcmcjax.samplers import build_sghmc_sampler, build_sghmcCV_sampler, build_sghmc_SVRG_sampler
from sgmcmcjax.samplers import build_baoab_sampler, build_sgnht_sampler, build_badodab_sampler
from sgmcmcjax.samplers import build_sgnhtCV_sampler, build_badodabCV_sampler
[24]:
data = (X, y_data)

key = random.PRNGKey(0)
Nsamples = 10000
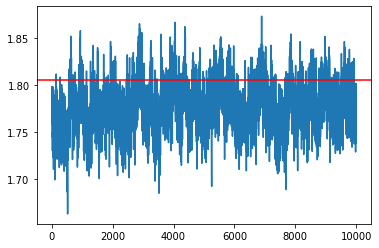
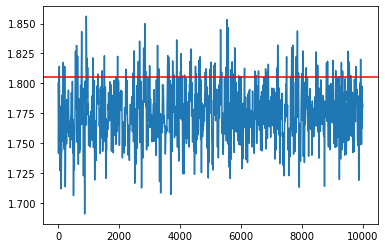
SGLD-CV
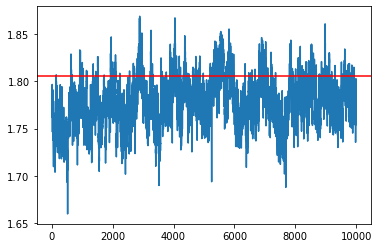
[25]:
my_sampler = build_sgldCV_sampler(1e-4, loglikelihood, logprior, data, batch_size, theta_true)
samples = my_sampler(key, Nsamples, theta_true)

idx = 7
plt.plot(np.array(samples)[:,idx])
plt.axhline(theta_true[idx], c='r')
plt.show()
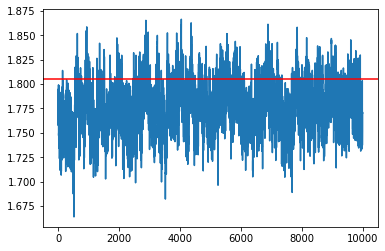
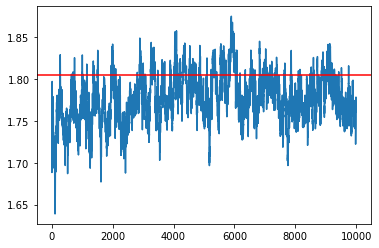
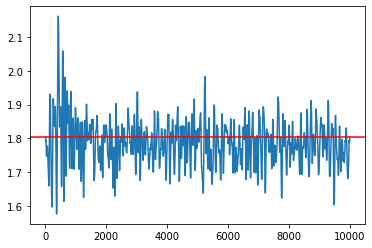
SVRG-sgld
[27]:
update_rate = 100
my_sampler = build_sgld_SVRG_sampler(1e-4, loglikelihood, logprior, data, batch_size, update_rate)
samples = my_sampler(key, Nsamples, theta_true)

idx = 7
plt.plot(np.array(samples)[:,idx])
plt.axhline(theta_true[idx], c='r')
plt.show()
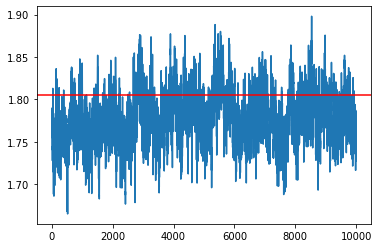
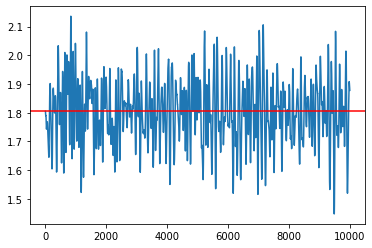
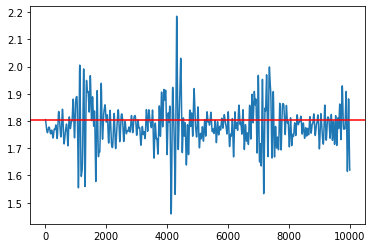
SGHMC
[29]:
L = 10
# batch_size = int(0.01*X.shape[0])
my_sampler = build_sghmc_sampler(1e-6, L, loglikelihood, logprior, data, batch_size)
samples = my_sampler(key, Nsamples, theta_true)

idx = 7
plt.plot(np.array(samples)[:,idx])
plt.axhline(theta_true[idx], c='r')
plt.show()
SGHMC-CV
[30]:
L = 10
my_sampler = build_sghmcCV_sampler(1e-6, L, loglikelihood, logprior, data, batch_size, theta_true)
samples = my_sampler(key, Nsamples, theta_true)

idx = 7
plt.plot(np.array(samples)[:,idx])
plt.axhline(theta_true[idx], c='r')
plt.show()
SGHMC-SVRG
[31]:
L = 10
update_rate = 1000
my_sampler = build_sghmc_SVRG_sampler(1e-6, L, loglikelihood, logprior, data, batch_size, update_rate)
samples = my_sampler(key, Nsamples, theta_true)

idx = 7
plt.plot(np.array(samples)[:,idx])
plt.axhline(theta_true[idx], c='r')
plt.show()
pSGLD
[32]:
my_sampler = build_psgld_sampler(1e-2, loglikelihood, logprior, data, batch_size)
samples = my_sampler(key, Nsamples, theta_true)

idx = 7
plt.plot(np.array(samples)[:,idx])
plt.axhline(theta_true[idx], c='r')
plt.show()
BAOAB
[33]:
gamma = 5
my_sampler = build_baoab_sampler(1e-3, gamma, loglikelihood, logprior, data, batch_size)
samples = my_sampler(key, Nsamples, theta_true)

idx = 7
plt.plot(np.array(samples)[:,idx])
plt.axhline(theta_true[idx], c='r')
plt.show()
SGNHT
[34]:
my_sampler = build_sgnht_sampler(1e-5, loglikelihood, logprior, data, batch_size)
samples = my_sampler(key, Nsamples, theta_true)

idx = 7
plt.plot(np.array(samples)[:,idx])
plt.axhline(theta_true[idx], c='r')
plt.show()
SGNHT-CV
[35]:
my_sampler = build_sgnhtCV_sampler(1e-5, loglikelihood, logprior, data, batch_size, theta_true)
samples = my_sampler(key, Nsamples, theta_true)

idx = 7
plt.plot(np.array(samples)[:,idx])
plt.axhline(theta_true[idx], c='r')
plt.show()
BADODAB
[36]:
my_sampler = build_badodab_sampler(1e-3, loglikelihood, logprior, data, batch_size)
samples = my_sampler(key, Nsamples, theta_true)

idx = 7
plt.plot(np.array(samples)[:,idx])
plt.axhline(theta_true[idx], c='r')
plt.show()
BADODAB-CV
[37]:
my_sampler = build_badodabCV_sampler(1e-3, loglikelihood, logprior, data, batch_size, theta_true)
samples = my_sampler(key, Nsamples, theta_true)

idx = 7
plt.plot(np.array(samples)[:,idx])
plt.axhline(theta_true[idx], c='r')
plt.show()
[ ]: