[1]:
%matplotlib inline
import matplotlib.pyplot as plt
import numpy as np
from tqdm.auto import tqdm

import jax.numpy as jnp
from jax import random, jit
Build a diffusion solver
In this series of notebooks we use logistic regression as the example. However the usage is exactly the same for other models.
Here we go to the lowest level of abstraction in SGMCMCJax: the solver for the diffusion.
[2]:
# import model and create dataset
from sgmcmcjax.models.logistic_regression import gen_data, loglikelihood, logprior

key = random.PRNGKey(42)
dim = 10
Ndata = 100000

theta_true, X, y_data = gen_data(key, dim, Ndata)

data = (X, y_data)
WARNING:absl:No GPU/TPU found, falling back to CPU. (Set TF_CPP_MIN_LOG_LEVEL=0 and rerun for more info.)
generating data, with N=100000 and dim=10
Here we import the solver for the Langevin diffusion for SGLD. We also import the function that builds the gradient of the log-posterior.
The usage of the diffusion function is very similar to JAX optimizer’s module. Calling sgld(1e-5) return 3 functions:
init_fn: this takes in the initial parameter and returns astateobjectupdate: this takes in the iteration number, random key, gradient, and state. It returns the updated stateget_params: this takes in astateobject and returns the parameter
Note that here we must calculate the gradient at each iteration ourselves. This is useful if the data doesn’t fit in memory so must be regularly loaded into memory. It is also useful if we want to implement our own gradient estimator that isn’t included in the package.
In this example we simply use the entire dataset with a Langevin diffusion. As a result this sampler is the Unadjusted Langevin Algorithm.
[3]:
from sgmcmcjax.diffusions import sgld
from sgmcmcjax.util import build_grad_log_post
[4]:
init_fn, update, get_params = sgld(1e-5)
update = jit(update)
grad_log_post = build_grad_log_post(loglikelihood, logprior, data)
[5]:
%%time

Nsamples = 1000
state = init_fn(theta_true)
samples = []

for i in tqdm(range(Nsamples)):
    key, subkey = random.split(key)
    mygrad = grad_log_post(get_params(state), *data) # use all the data.
    state = update(i, subkey, mygrad, state)
    samples.append(get_params(state))

samples = np.array(samples)
CPU times: user 1.82 s, sys: 64.6 ms, total: 1.89 s
Wall time: 1.62 s
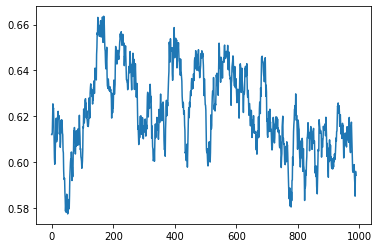
[6]:
plt.plot(samples[10:,1])
[6]:
[<matplotlib.lines.Line2D at 0x7fb69bb492e0>]
[ ]: